

In 2026, global digital signage market measurements consistently place the industry in the US$23-29 billion range, depending on how hardware, software, and services are defined. Multiple 2026 valuations confirm continued expansion from 2024, with reported year-over-year growth rates between 6.5% and 9.1%. While baseline estimates differ, all 2026 figures indicate that digital signage remains in an active growth phase rather than a mature or declining market.
Looking forward from 2026, long-term projections remain aligned around steady expansion through the end of the decade and beyond. Forecasts that start in 2026 project the market reaching US$34 billion by 2029, US$41-46 billion by 2030, and US$46-58 billion by the early-to-mid 2030s, with compound annual growth rates ranging from 5.56% to 10.3% depending on the forecast window.
Taken together, the 2026 data positions digital signage as a stable, infrastructure-driven global market with sustained multi-year growth.
Table Of Contents
- Overall Market Size and Growth (2026)
- Regional Market and Share (2026)
- Market Segmentation and Product Categories (2026)
- DOOH Advertising and Performance (2026)
- Industry-Specific Adoption and Impact (2026)
- Digital Signage Statistics for Retail (2026)
- Digital Signage Statistics for Restaurants, Hospitality, and Transit (2026)
- Digital Signage Statistics for Education (2026)
- Digital Signage Statistics for Manufacturing and Workplace Safety (2026)
- Digital Signage Statistics for Banking and Finance (2026)
- Digital Signage Statistics for Healthcare (2026)
- Digital Signage Statistics for Corporate Communications and Internal Engagement (2026)
- Digital Signage Statistics for Manufacturing and Industrial Operations (2026)
- Digital Signage Statistics for Media and Advertising Effectiveness (2026)
- Digital Signage Statistics for Transportation Industry (2026)
- Digital Signage Statistics for Corporate and Office Spaces (2026)
- Digital Signage Statistics for Retail Media and Advertising Networks (2026)
- Digital Signage Statistics for Smart Retail and Emerging Technologies (2026)
- Digital Signage Statistics for Education and Corporate Sector Trends (2026)
- Digital Signage Statistics for Media Player and Technology Trends (2026)
- Digital Signage Research and Analytics Outlook (2026)
- Digital Signage Adoption and ROI (2026)
- Frequently Asked Questions
- What is the total market size for digital signage in 2026?
- How much does digital signage increase retail sales and foot traffic?
- How long does it take to set up a digital signage screen?
- What percentage of the OOH market will be digital in 2026?
- How much does it cost to use PosterBooking for digital signage?
- Sources
Overall Market Size and Growth (2026)
In 2026, global digital signage market estimates place the industry between US$23.05 billion and US$29.19 billion, with growth into 2026 reported as high as 9.1% and multi-year forecasts extending to US$34 billion by 2029 and beyond US$41-46 billion by 2030.
Below are the 2026 statistics covering overall market size and growth.
- Market Size (2026): The global digital signage market grows from US$21.65 billion in 2024 to US$23.05 billion in 2026, reflecting a 6.5% CAGR, and the 2026 outlook projects US$34 billion by 2029 at a 10.2% CAGR.
- Market Forecast (2026): The global market is forecast at US$24.41 billion in 2026, with a projection to reach US$39.79 billion by 2033, reflecting a 6.3% CAGR during 2026-2033 from a 2026 baseline.
- Market Projection (2026): The global digital signage market is estimated at US$27.66 billion in 2026 and projected to reach US$41.39 billion by 2030, reflecting an 8.39% CAGR for 2026-2030.
- Growth Outlook (2026): From a 2026 growth window, the market is expected to reach US$45,941.2 million by 2030, translating to an 8.1% CAGR for 2026-2030, using a US$28,827.1 million 2024 baseline feeding into 2026.
- Year-Over-Year Growth (2026): Growth between 2024 and 2026 is estimated at 9.1%, while the market is forecast to expand by US$11.14 billion during 2024-2029, reflecting a 10.3% CAGR that includes the 2026 period.
- Long-Term Projection (2026): The market is valued at US$29.19 billion in 2026 and projected to reach US$57.72 billion by 2035, yielding a 7.06% CAGR from 2026-2034.
- Mid-Term Forecast (2026): The market is forecast to reach US$28.27 billion in 2026 (up from US$26.21 billion in 2024) and grow toward US$48.61 billion by 2032, reflecting an 8.02% CAGR from the 2026 baseline.
- Expansion Outlook (2026): The market is projected to expand from US$27.496 billion in 2026 to US$38.992 billion by 2030, implying a 7.24% CAGR from the 2026 start point.
- CAGR Window (2026): The market is forecast to reach US$48.95 billion by 2033, implying a 5.56% CAGR for 2026-2033, using a US$28.5 billion 2024 baseline feeding into 2026.
- CAGR Window (2026): The market is projected to reach US$46.80 billion by 2033, reflecting a 7.97% CAGR over 2026-2033, using a US$23.47 billion 2024 baseline feeding into 2026.
Regional Market and Share (2026)
In 2026, digital signage revenue remains regionally concentrated, with North America holding roughly 33.4%-37.2% share across the benchmarks used for 2026 planning, while the U.S. market reaches US$9.16 billion in 2026 and continues scaling toward US$13.38 billion by 2030.
Below are the 2026 statistics covering regional market share, DOOH revenue, and leading vendor shares.
- U.S. Market Size (2026): The U.S. digital signage market is US$9.16 billion in 2026 and is projected to reach US$13.38 billion by 2030, reflecting a 7.88% CAGR from the 2026 baseline.
- North America Growth (2026): The North American digital signage market is projected to grow from US$7.17 billion in 2026 to US$9.16 billion by 2030, reflecting a 5% CAGR, while Canada is expected to record an 8.9% CAGR from the 2026 outlook.
- North America Mix (2026): Within North America in 2026, software represents 16.8% of market revenue, and displays larger than 52 inches are predicted to dominate market share in the 2026 deployment mix.
- DOOH Revenue (2026): Digital out-of-home advertising revenue totals US$19.1 billion in 2026 and is projected to reach US$26.5 billion by 2030, while the overall digital signage market is expected to reach US$49.4 billion by 2034 at an 8.5% CAGR for 2026-2034.
- North America Share (2026 Context): North America holds 37.2% of the global digital signage market in the baseline period feeding into 2026, and the U.S. accounts for 87.70% of the North American market used for 2026 regional context.
- Global Regional Split (2026): Global market revenue distribution in 2026 is reported as North America 33.8%, Asia-Pacific 30.1%, Europe 25.4%, Latin America 6.9%, and Middle East & Africa 3.8%.
- North America Share Cross-Check (2026 Context): North America represents 33.4% of global spending used as a baseline for 2026 positioning, and Asia-Pacific is expected to be the fastest-growing region from the 2026 outlook with an 8.5% CAGR.
- North America Share Cross-Check (2026 Context): North America accounts for 34.2% of the global market used for 2026 benchmarking, and video wall revenue is highlighted at US$7,712.4 million as the baseline reference feeding into 2026 category context.
- Vendor Share (2026): Global market share in 2026 is reported as Exceptional 3D 15%, Samsung Electronics 12%, Panasonic 12%, LG Electronics 11%, Scala 9%, Sony 9%, Leyard Optoelectronics 8%, and other companies 14%.
Market Segmentation and Product Categories (2026)
In 2026, digital signage spending is shaped by a hardware-led mix and large-format, high-impact formats, with video walls at 27% share in 2026, hardware at 56.6% of revenue in 2026, and LED technology at 47% in 2026, while deployment patterns remain mainly on-premises (69.8%) and indoor (66.8%) as the 2026 baseline. ‘
Below are the 2026 statistics covering market segmentation, product categories, media players, and technology deployment trends.
- Category Share (2026): In 2026, video walls hold 27% of global market share, hardware accounts for 56.6% of revenue, LED technology represents 47%, broadcast-content displays account for 81%, 32-inch displays represent 41%, and retail contributes 21% of global revenue.
- Hardware Share (2026 Context): Hardware captures 60.7% of digital signage revenue used as the segment baseline feeding into 2026, while software is growing at a 10.5% CAGR across the 2026 growth window.
- Video Wall Share (2026 Context): Video walls account for 28.1% of the market used for 2026 category positioning, based on the baseline measurement feeding into 2026 deployment assumptions.
- Deployment Mix (2026 Context): On-premises systems generate 69.8% of revenue used for 2026 deployment planning, while indoor installations represent 66.8% of sales used for 2026 environment mix assumptions.
- Connectivity Growth (2026): Wireless connectivity is experiencing an 11.91% CAGR from the 2026 connectivity outlook, supporting wireless-first deployment planning after 2026.
- Media Player Segment (2026): The digital signage media player market totals US$2.13 billion in 2026 and is projected to reach US$3.29 billion by 2030 at a 9.08% CAGR from the 2026 baseline.
- Media Player Mix (2026 Context): Hardware accounts for 62.70% of the media player market used for 2026 procurement baselining, while software expands at a 10.31% CAGR across the 2026 growth window.
- Media Player Tiering (2026): Advanced-level players generate 46.8% of revenue in the media player market used for 2026 tier analysis, while enterprise-level solutions grow at a 10.51% CAGR from the 2026 enterprise outlook.
- Media Player Connectivity (2026): Wireless connectivity accounts for 67.9% of deployments used for 2026 rollout strategy, confirming wireless-heavy deployment patterns in 2026.
- Hardware Segment Value (2026 Context): The hardware segment is valued at US$13.4 billion in the baseline period used for 2026 segment context, while software is forecast to grow at a 10.1% CAGR from the 2026 software outlook.
- Retail and Vertical Value (2026 Context): Retail generates US$6.9 billion in the baseline period used for 2026 retail context, healthcare holds a 20.2% share used for 2026 vertical benchmarking, and small business deployments are valued at US$9.4 billion in the baseline used for 2026 SMB context.
- LCD Panel Shipments (2026 Context): Professional LCD signage panel shipments are expected to reach 7.8 million units in the baseline feeding into 2026 supply planning, representing 1.6 million more than 2023.
- Fine-Pitch LED Volume (2026 Context): Fine-pitch indoor LED deliveries reach 124,000 m² of sub-1.5 mm cabinets in the baseline period feeding into 2026 LED capacity planning.
- Embedded Analytics Displays (2026 Context): Approximately 210,000 displays are expected to ship with embedded time-of-flight cameras in the baseline feeding into 2026 analytics-enabled deployments.
- Transit Platform Screens (2026 Context): Subway operators plan to add 41,000 platform-edge screens in the baseline feeding into 2026 transit network expansion context.
- Convenience Retail Rollouts (2026 Context): North American convenience chains led by 7-Eleven are rolling out 15,600 countertop displays optimized for 24-inch panels in the baseline feeding into 2026 retail micro-display planning.
- SoC Adoption (2026 Context): Retail chains are adopting system-on-chip screens that eliminate media players in approximately 3.2 million installations in the baseline feeding into 2026 architecture planning.
DOOH Advertising and Performance (2026)
In 2026, DOOH expands its share of out-of-home advertising, accounting for 30-35% of OOH spend in 2026 while growing 10-12% annually in 2026, supported by a global OOH market valued around US$40-45 billion in 2026 and forecast at US$41.82 billion in 2026.
Below are the 2026 statistics covering DOOH reach, impressions, recall, engagement lifts, and action outcomes.
- DOOH Share of OOH Spend (2026): Digital out-of-home (DOOH) accounts for 30-35% of all out-of-home (OOH) advertising spend in 2026, and DOOH spending grows 10-12% annually in 2026, outpacing traditional OOH growth.
- OOH Market Value and Impressions (2026): The global OOH advertising market is valued around US$40-45 billion in 2026, and DOOH screens deliver 1,000-10,000 impressions per play in 2026.
- Weekly Reach and Billboard Noticing (2026): In 2026, OOH advertising reaches 90% of urban residents each week, and 71% notice billboards in 2026.
- Interactive Retention Lift (2026): Interactive DOOH experiences increase customer retention by 40% in 2026.
- Weather-Triggered Engagement Lift (2026): Weather-triggered DOOH campaigns increase engagement by 50% in 2026.
- Geo-Fenced Retargeting Conversions (2026): Geo-fenced retargeting after viewing a DOOH ad boosts conversions by 20-30% in 2026.
- Mall Dwell Time Advantage (2026): DOOH dwell times in shopping malls can be 10-30× longer in 2026 than roadside billboard exposures.
- Global OOH Revenue Forecast (2026): Global OOH revenue is predicted to reach US$41.82 billion in 2026, with digital OOH growing 8.44% annually in 2026 to US$22 billion.
- Digital Billboard Noticing and Recall (2026): In 2026, 62% of consumers noticed a digital billboard in the past month, and aided recall for DOOH is around 82%.
- Contextual Trigger Effectiveness (2026): Contextual triggers like weather or time adjustments increase DOOH effectiveness by ~17% in 2026.
- Daily Urban Reach and 3D Attention (2026): DOOH advertising reaches 65% of people in urban areas daily in 2026, and 3D DOOH ads hold attention 2× longer in 2026 than static displays.
- Digital vs Online Noticing and Dynamic Recall (2026): In 2026, 52% of consumers say they are more likely to notice digital signage than online ads, and 83% recall dynamic digital content.
- Favorability by Channel (2026): In 2026, 73% view DOOH ads favorably, compared with 50% for TV, 48% for social media, and 31% for print.
- Action Rates After Exposure (2026): In 2026, 76% of consumers take action after seeing a DOOH ad, and 74% of mobile users act on their phones after seeing a DOOH ad.
- Creative Impact on Action (2026): In 2026, 80% of viewers are more likely to act when DOOH ads are visually bold or creatively engaging.
- Directions-to-Visit-to-Purchase Funnel (2026): In 2026, when DOOH ads provide directions, 51% of viewers visit the business, and 93% of those visitors make a purchase.
- Contextual Usefulness (2026): In 2026, 86% find grocery deals on DOOH helpful, 81% find weather-responsive ads relevant, and 80% appreciate time-based offers.
Industry-Specific Adoption and Impact (2026)
Digital Signage Statistics for Retail (2026)
In 2026, retail digital signage metrics show strong influence across the shopper journey, with 90% finding video helpful for purchase decisions in 2026, 76% entering stores due to appealing digital signage in 2026, and 67% purchasing based on on-screen content in 2026, alongside measurable lifts like 24% higher foot traffic and sales growth up to 33% in 2026.
Below are the 2026 retail industry statistics covering shopper behavior, conversion impact, wait-time perception, and revenue mix by screen format.
- Video Helpfulness and Store Entry (2026): In 2026, 90% of shoppers find videos helpful for purchase decisions, 76% enter a store due to appealing digital signage, and 67% make purchases based on content seen on digital screens.
- Foot Traffic and Sales Lift (2026): In 2026, digital signage increases foot traffic by 24% and can drive sales growth of up to 33% in retail settings.
- Kiosk Preference and Wait-Time Perception (2026): In 2026, 80% of millennials prefer stores with interactive kiosks, and digital signage reduces perceived wait times by 35%.
- Retail Format Revenue Mix (2026): In 2026, video walls account for US$7 billion in revenue, video screens US$6 billion, digital posters US$4 billion, transparent LED screens US$4 billion, and kiosks US$2 billion.
- In-Store Decision Timing (2026): In 2026, 70% of purchase decisions occur once shoppers are inside the store, supporting the role of DOOH-style screens for timely promotions.
- Millennial Purchase and Confidence Signals (2026): In 2026, 72% of millennials are more likely to purchase from a brand that uses digital signage, and 80% of shoppers feel more confident when digital tools help them decide.
- Deal-Checking and Menu Preferences (2026): In 2026, 54% consciously check digital screens for deals at entry, 74% prefer digital menu boards to handheld menus, 52% would enter a new store if the digital sign is interesting, and 30% use digital signage for product information.
- Signage as Store Discovery and Quality Signal (2026): In 2026, 76% have entered a store they had never visited before based on its signs, and 68% believe signage reflects product quality.
- No-Sign Deterrence and Word-of-Mouth (2026): In 2026, 60% say the absence of a sign deters entry, and 75% have told someone about a business based on its signage.
- Eye-Catch Purchases and Poor-Signage Avoidance (2026): In 2026, 68% have purchased because a sign caught their eye, and 52% are less willing to enter a store with poor signage.
- Curiosity and Store Entry From Digital (2026): In 2026, 59% of people who see digital signage want to learn more, and 80% admit entering a store because a digital sign caught their interest.
Digital Signage Statistics for Restaurants, Hospitality, and Transit (2026)
In 2026, restaurants and hospitality digital signage is increasingly tied to measurable engagement and revenue outcomes, including 35% higher engagement and 20% higher purchases in March 2026 from an AI-driven pilot, plus hospitality indicators such as 65% of hotel guests saying signage improved their stay in 2026, 15% upsell-driven revenue lifts in 2026, and digital menu board preference signals like 74% favoring easy-to-read boards and 29.5% reporting purchase influence in 2026.
Below are the 2026 restaurants, hospitality, and transit statistics covering pilots, signage, menu board market growth, guest experience, and technology adoption.
- Retail AI Pilot Impact (2026): In March 2026, an AI-driven pilot increased customer engagement by 35% and boosted purchases by 20%.
- Transit 4K Pilot Impact (2026): In mid-2026, an interactive 4K bus-stop pilot increased ad interactions by 40% and commuter satisfaction by 25%.
- Metro Smart-Signage Trial (2026): In 2026, a metro trial using smart-behaviour signage improved passenger engagement by 18%.
- Taxi AI Rooftop Context (2026): In 2026, a referenced rollout of 1,000 taxis equipped with AI rooftop signage (from 2024) increased advertising revenue by 25%.
- Hospitality Menu Board Market Path (2026): In 2026, the hospitality digital menu board market is projected to grow from US$2.478 billion (2024) to US$4.09 billion by 2032, reflecting a 6.5% CAGR through the 2026 forecasting window.
- Guest Experience and Engagement (2026): In 2026, 65% of hotel guests feel digital signage improved their stay, and 70% find it engaging.
- Self-Check-In Preference (2026): In 2026, 55% of travelers prefer hotels with self-check-in kiosks.
- Hotel Tech Spend and Revenue Expectation (2026): In 2026, hotels expect technology spending to increase 16%, and 85% of hoteliers think technology can provide more than 5% incremental revenue.
- Upsell Lift and Adoption Plans (2026): In 2026, properties using digital signage see 15% revenue lifts from upselling, and over 60% of hotels plan to adopt digital signage by 2026.
- Menu Readability and Purchase Influence (2026): In 2026, 74% of customers prefer easy-to-read digital menu boards, and 29.5% say digital menus influence buying decisions.
- Healthcare and Airport Recall (2026): In 2026, 75% of hospital patients recall digital signage messaging during their stay, and 55% of travelers feel airport digital signage improves their travel experience.
Digital Signage Statistics for Education (2026)
In 2026, education digital signage adoption is widespread and deeply operational, with 73% of institutions calling it vital in 2026, 70% of campuses running digital displays in 2026, and 87% of institutions already adopted in 2026, while usage concentrates on core communications like 100% using signage for institutional news and 57% for scheduling and emergency alerts in 2026.
Below are the 2026 education statistics covering adoption rates, campus use cases, student recall, and learning impact signals.
- Institutional Adoption (2026): According to Market.us, 73% of educational institutions consider digital signage vital in 2026, 70% of campuses have digital displays in 2026, and 87% of institutions have adopted digital signage in 2026.
- Primary Education Use Cases (2026): According to Market.us, 100% of institutions use digital signage for institutional news in 2026, 86% use digital menu boards in 2026, 57% use it for scheduling and emergency notifications in 2026, 43% use it for wayfinding in 2026, and 14% monetize networks via third-party advertising in 2026.
- Student Achievement Displays (2026): According to Gitnux, 44% of schools use digital signage to showcase student work and achievements in 2026.
- Learning Impact Metrics (2026): According to Gitnux, 96% of students believe video content positively impacts learning in 2026, and technology integration reduces student stress by 45%, improves confidence by 46%, and increases learning efficiency by 57% in 2026.
- Message Recall on Campus (2026): According to Gitnux, the recall rate among students for digital signage messages is 96% in 2026.
- Public Exposure to Digital Video (2026): According to Gitnux, digital video reaches 70% of the public in a typical month in 2026, and 70% of Americans report seeing a digital video display in a public venue in the past month in 2026.
- Digital Channel Preference (2026): According to Gitnux, 97% of students favor digital channels for communication in 2026, and 53% of teachers want multichannel campaign tools for campus communication in 2026.
Digital Signage Statistics for Manufacturing and Workplace Safety (2026)
In 2026, manufacturing and workplace safety metrics position digital signage as both a safety tool and a productivity system, with reported impacts including a 20% reduction in workplace injuries and illnesses in 2026, 22% higher workplace engagement in 2026, and a 41% reduction in quality defects in 2026, alongside strong economic signals such as US$4-6 ROI per US$1 invested in safety communication in 2026.
Below are the 2026 manufacturing and workplace safety statistics covering safety outcomes, training adoption, cost savings, engagement gains, and internal communication impacts.
- Safety and Training Adoption (2026): According to Market.us, digital signage reduces workplace injuries and illnesses by 20% in 2026, 93% of manufacturers use digital signage at trade shows in 2026, and 90% use it for employee training in 2026.
- Engagement and Quality Outcomes (2026): According to Market.us, manufacturing facilities see a 22% improvement in workplace engagement in 2026 and a 41% reduction in quality defects in 2026 when digital signage is used for communication.
- Safety ROI (2026): According to Market.us, every US$1 invested in safety communication via digital signage returns US$4-6 in 2026.
- Paper-to-Digital Cost Reduction (2026): According to Gitnux, replacing paper notices with digital signage reduces printing costs by 30% in 2026, and digital signage reduces workplace injury rates by 20% in 2026.
- Lost Days and Retention (2026): According to Gitnux, safety reminders on digital signage reduce lost days due to accidents by 12% annually in 2026, and employee recognition on screens increases retention by up to 15% in 2026.
- Internal Communication and Shareholder Returns (2026): According to Gitnux, digital signage improves internal communication efficiency by 20-25% in 2026, and companies with effective internal communication experience 47% higher returns to shareholders in 2026.
- Investment Intent and Social Feeds (2026): According to Gitnux, 56% of internal communication teams are considering increasing investment in digital signage in 2026, and 50% of communications professionals use digital signage to share social media feeds in 2026.
- Room Booking and Queue Experience (2026): According to Gitnux, digital room-booking displays reduce meeting-room conflicts by 40% in 2026, digital queue management increases customer satisfaction by 46% in 2026, and interactive digital signage generates 5× more engagement than static signage in 2026.
- Event Attendance Lift (2026): According to Gitnux, digital signage increases attendance at company events by 25% in 2026.
Digital Signage Statistics for Banking and Finance (2026)
In 2026, banking digital signage is closely linked to trust-building and in-branch engagement, with 87% of customers saying it enhances trust in 2026, 60% of banks using it for engaging content in 2026, and 9 out of 10 banks rating it important for in-branch marketing in 2026, while usage also targets customer experience through wait-time anxiety reduction in 2026.
Below are the 2026 banking and finance statistics covering trust impact, in-branch content mix, recall signals, and credibility perception.
- Trust and In-Branch Use (2026): According to Market.us, 87% of banking customers say digital signage enhances trust in 2026, 60% of banks use digital signage for engaging content in 2026, 75% of displayed content is bank-related in 2026, and 9 out of 10 banks consider digital signage important for in-branch marketing in 2026.
- Waiting Anxiety Reduction (2026): According to Gitnux, 70% of banks use digital signage to reduce customer waiting anxiety in 2026.
- Airport Digital Ad Recall (2026): According to Gitnux, 52% of travelers recall seeing digital ads at airports in 2026, supporting airline-bank co-marketing relevance in 2026.
- Credibility and Trend Discovery (2026): According to Gitnux, 69% of consumers view digital signage as a credible source of public information in 2026, and 66% look at digital signage to see the latest trends in 2026.
Digital Signage Statistics for Healthcare (2026)
In 2026, healthcare digital signage combines market growth with practical operational value, with the healthcare segment sized at US$0.75 billion in 2026 and projected to reach US$1.10 billion by 2030 from the 2026 baseline, while hospitals report strong adoption and impact signals such as 70% having digital communication systems and 75% of caregivers and patients saying signage improves the hospital experience in 2026.

Below are the 2026 healthcare statistics covering market growth, installation mix, patient behavior, message recall, engagement, and anxiety reduction.
- Healthcare Market Size (2026): According to MarketsandMarkets, the healthcare digital signage market grows from US$0.75 billion in 2026 to US$1.10 billion by 2030, reflecting an 8% CAGR from the 2026 baseline.
- Hardware and Display Size Mix (2026): According to MarketsandMarkets, hardware holds the largest market share in healthcare digital signage in 2026, and displays above 52 inches hold the highest share in 2026.
- Installation Type Dominance (2026): According to MarketsandMarkets, stand-alone displays dominate healthcare digital signage installations in 2026.
- Hospital System Penetration (2026): According to Market.us, 70% of hospitals have digital communication systems in 2026, 64% of physicians believe IoT and digital solutions reduce workload in 2026, and 75% of caregivers and patients say digital signage improves hospital experience in 2026.
- Patient Digital Behavior (2026): According to Market.us, 78% of patients actively seek digital health solutions in 2026, and 52% obtain health information from digital signage in 2026.
- Recall, Engagement, and Discovery (2026): According to Market.us, 75% of patients recall at least one message delivered via digital signage in 2026, 83% engage with digital content in 2026, and 27% discovered healthcare providers through digital signage in 2026.
- Anxiety Reduction (2026): According to Gitnux, digital signage in waiting rooms reduces patient anxiety by 35% in 2026.
- Caregiver Communication Value (2026): According to Gitnux, 75% of caregivers view digital signage as a way to enhance hospital communications in 2026.
Digital Signage Statistics for Corporate Communications and Internal Engagement (2026)
In 2026, corporate digital signage is strongly tied to internal engagement and operational efficiency, with reported outcomes including 25% higher workplace engagement in 2026, internal communication efficiency gains of 20-25% in 2026, and measurable time savings of 15 minutes per employee per day in 2026, alongside investment momentum where 56% of internal communication teams plan to increase spending in 2026.
Below are the 2026 corporate communications and internal engagement statistics covering engagement lift, productivity, retention, event participation, room-booking efficiency, and safety reminder impact.
- Engagement Gains (2026): According to Market.us, digital signage improves workplace engagement by 25% in 2026, and can quadruple employee engagement in 2026 by keeping staff informed.
- Shareholder Returns Link (2026): According to Gitnux, companies with effective internal communication via signage produce 47% higher returns to shareholders in 2026.
- Communication Efficiency and Investment Plans (2026): According to Gitnux, digital signage improves internal communication efficiency by 20-25% in 2026, and 56% of internal communication teams plan to increase signage investment in 2026.
- Profitability and Employee Sentiment (2026): According to Gitnux, organizations with high employee engagement supported by visual communication report 21% higher profitability in 2026, and 98% of employees feel digital signage improves internal communication in 2026.
- Time Savings (2026): According to Gitnux, digital signage saves employees 15 minutes per day in 2026 by delivering information visually.
- Events and Retention (2026): According to Gitnux, digital signage increases attendance at company events by 25% in 2026, and digital recognition displays improve retention by up to 15% in 2026.
- Social Feed Usage (2026): According to Gitnux, 50% of communications professionals use digital signage to share social media feeds in 2026.
- Room Booking Conflicts (2026): According to Gitnux, digital room-booking signs reduce meeting-room conflicts by 40% in 2026.
- Shopper Mood and Dwell Time (2026): According to Gitnux, 81% of shoppers say entertainment content on digital signage improves mood in 2026, and interactive digital signage increases customer dwell time by 30% in 2026.
- Safety Reminder Effect (2026): According to Gitnux, digital signage reduces workplace injury rates by 20% in 2026 when used for safety reminders.
Digital Signage Statistics for Manufacturing and Industrial Operations (2026)
In 2026, manufacturing and industrial operations data highlights a clear shift toward scalable, wireless, and SoC-driven signage infrastructure, with 67.9% of media-player deployments using wireless connectivity in 2026, service contracts reaching 1.4× the initial hardware sale value in 2026, and performance benchmarks hitting 0.9 mm fine-pitch indoor LED, 3,500-nit outdoor QSR displays, and 8,000-nit DOOH spectacular brightness levels in 2026.
Below are the 2026 manufacturing and industrial operations statistics covering media-player deployment mix, wireless growth, hardware supply concentration, and next-gen display specifications.
- Media Player Deployment Split (2026): According to Mordor, retail applications hold 36.9% share in media-player deployments in 2026, while North America commands 33.2% of media-player market revenue in 2026.
- Wireless Deployment Share and Growth (2026): According to Mordor, wireless connectivity is used in 67.9% of deployments in 2026 and is growing at an 11.91% CAGR from the 2026 outlook.
- LCD Panel Supply Concentration (2026 Context): According to Astute Analytica, more than 5.9 million LCD signage panels were supplied by Samsung Display, LG Display, and BOE in the baseline feeding into 2026 planning.
- Service Contract Expansion (2026): According to Astute Analytica, major integrators secure multi-year service contracts valued at 1.4× the initial hardware sale in 2026.
- Pixel Pitch and Brightness Benchmarks (2026): According to Astute Analytica, fine-pitch indoor LED walls reach 0.9 mm pixel pitch in 2026, new outdoor QSR displays operate at 3,500 nits in 2026, and high-impact DOOH spectaculars such as TSX Broadway run at 8,000 nits in 2026.
- SoC Screen Shift (2026): According to Astute Analytica, 9 of the 10 highest-shipping SKUs integrate quad-core SoCs and 8 GB RAM in 2026, eliminating standalone media players in roughly 3.2 million installations in 2026.
- Unit-Volume Consumption Mix (2026): According to Astute Analytica, retail, transportation, and corporate communication account for about three-quarters of global consumption by unit volume in 2026.
Digital Signage Statistics for Media and Advertising Effectiveness (2026)
In 2026, media effectiveness data shows digital signage and DOOH delivering strong recall, attention, and action outcomes, with advertisers prioritizing personalization (91% in 2026), buyers reporting higher visibility versus online channels (digital signage reaching 70% of Americans in 2026), and performance signals like 83% recall in 2026, 400% more views than static in 2026, and sales lifts up to 33% in 2026 tied to signage-led influence.
Below are the 2026 media and advertising effectiveness statistics covering reach, recall, attention share, engagement drivers, and behavioral impact.
- Personalization and Digital Priority (2026): According to Market.us, 91% of advertisers recognize consumer demand for personalized ads in 2026, 52% of marketers prioritize digital solutions in 2026, 76% of companies invest in interactive kiosks and IoT-based signage in 2026, and 86% consider cloud technology critical for digital transformation in 2026.
- Reach and Recall Benchmarks (2026): According to Market.us, digital signage reaches 70% of Americans in 2026 versus 43% who see content on the Internet in 2026, and 47% recall the ads in 2026.
- Traveler Recall and Repeat Message Memory (2026): According to Market.us, 82% of travelers recall digital billboard ads in 2026, and 55% remember the message each time they pass by in 2026.
- View Lift vs Static and Visual Attention (2026): According to Gitnux, digital signage captures 400% more views than static signage in 2026, 83% recall seeing at least one digital signage ad in the past month in 2026, and digital displays capture 47% of customer visual attention in 2026.
- Motion Recall Advantage and Standout Perception (2026): According to Gitnux, moving content has a 2.5× higher recall rate than static content in 2026, and 71% of consumers feel digital billboards stand out more than online ads in 2026.
- Brand Awareness and Sales Impact (2026): According to Gitnux, digital displays can increase brand awareness by 47.7% in 2026, and 80% of brands experience up to a 33% sales increase through digital signage in 2026.
- Recall and Impulse Purchase Effect (2026): According to Gitnux, digital signage has an average recall rate of 83% in 2026, and 19% of consumers admit to making an unplanned purchase after viewing digital signage in 2026.
- Innovation and Trend Discovery (2026): According to Gitnux, 61% of U.S. consumers perceive brands using digital signage as innovative in 2026, and 66% look at digital signage to see the latest trends in 2026.
- Information Value, Mood, and Revisit Intent (2026): According to Gitnux, 69% believe digital signage provides needed information in 2026, 81% say entertainment content improves mood in 2026, and 91% are more likely to revisit a store with interactive digital features in 2026.
- Interactive Dwell Time and Engagement Lift (2026): According to Gitnux, interactive digital signage typically achieves five minutes or more dwell time in 2026, and interactive content increases engagement by 30% in 2026.
- Wait-Time Perception and Video-Display Preference (2026): According to Gitnux, digital signage reduces perceived wait times by up to 35% in 2026, and 42% of retail shoppers prefer stores with video displays in 2026.
- Entertainment Extends Willingness to Wait (2026): According to Gitnux, 48% of customers are willing to wait longer when entertained by digital content in 2026.
- Unskippable Impressions (2026): According to InBeat, DOOH ads cannot be blocked or skipped in 2026, guaranteeing impressions because they appear in physical spaces in 2026.
Digital Signage Statistics for Transportation Industry (2026)
In 2026, transportation digital signage shows clear engagement and reach impact, including an 18% passenger engagement lift in 2026, a 40% increase in ad interactions and 25% higher commuter satisfaction in 2026 from interactive pilots, and transit-space DOOH reaching 65% of urban residents daily in 2026.
Below are the 2026 transportation statistics covering metro trials, bus-stop pilots, platform-edge screen expansion, daily reach, and airport recall.
- Metro Engagement Lift (2026): According to SkyQuest, Tokyo Metro’s smart-signage trial improves passenger engagement by 18% in 2026.
- Bus-Stop Interaction and Satisfaction (2026): According to SkyQuest, an AI-powered 4K bus-stop pilot in Paris increases advertising interactions by 40% in 2026 and commuter satisfaction by 25% in 2026.
- Platform-Edge Screen Expansion (2026 Context): According to Astute Analytica, subway operators plan to add 41,000 platform-edge screens in the baseline feeding into 2026 infrastructure scaling.
- Daily Transit Reach (2026): According to InBeat, DOOH advertising in transit spaces reaches 65% of urban residents daily in 2026.
- Airport Recall (2026): According to Gitnux, 52% of travelers recall seeing digital ads at airports in 2026.
Digital Signage Statistics for Corporate and Office Spaces (2026)
In 2026, corporate and office digital signage is positioned as a practical channel for deskless communication and measurable workplace efficiency, with deskless workers representing 80% of the global workforce in 2026, 50% of employees reporting productivity improvement from internal signage in 2026, and printing costs reduced by 30% annually in 2026, while internal communication accounts for 23% of corporate signage deployments in 2026.
Below are the 2026 corporate and office space statistics covering deskless workforce reliance, productivity, internal brand awareness, communication gaps, and decision influence.
- Deskless Workforce Reliance (2026): According to Gitnux, deskless workers make up 80% of the global workforce in 2026 and rely heavily on digital signage in 2026 due to limited email access.
- Productivity and Printing Savings (2026): According to Gitnux, 50% of employees feel internal digital signage improves productivity in 2026, and digital signage cuts printing costs by 30% annually in 2026.
- Internal Communication Deployment Share (2026): According to Gitnux, the corporate sector uses 23% of digital signage deployments for internal communication in 2026.
- Engagement and Internal Brand Awareness (2026): According to Gitnux, digital signage increases employee engagement by 22% in manufacturing-linked workplace settings in 2026 and improves internal brand awareness by 45% in 2026.
- Achievement Awareness Gap (2026): According to Gitnux, 47% of employees say they are not aware of company achievements in 2026, a gap internal signage helps address in 2026.
- Interactive Video Preference and Decision Influence (2026): According to Gitnux, 48% of customers prefer stores with video displays requiring touch interaction in 2026, and 33% of shoppers make decisions based on information from store signage in 2026.
Digital Signage Statistics for Retail Media and Advertising Networks (2026)
In 2026, retail media and advertising networks use digital signage and DOOH to drive measurable action and engagement, with 76% of consumers taking action after DOOH exposure in 2026, 74% following up via mobile in 2026, and creative strength mattering because 80% are more likely to act when ads are visually bold in 2026.
Below are the 2026 retail media and advertising network statistics covering cross-sector adoption, action rates, retention lift, contextual performance gains, and guaranteed impression value.
- Sector Adoption Coverage (2026): According to Market.us, education, manufacturing, banking, retail, media/advertising, and healthcare are actively adopting digital signage in 2026, supported by the sector statistics summarized earlier.
- Action After DOOH Exposure (2026): According to InBeat, 76% of consumers report taking action after seeing a DOOH ad in 2026, and 74% of mobile users perform online actions after DOOH exposure in 2026.
- Creative Impact on Action (2026): According to InBeat, 80% of viewers are more likely to act when DOOH ads are visually bold in 2026.
- Retention and Dwell Time Lift (2026): According to Marketing LTB, interactive DOOH experiences increase retention by 40% in 2026, and DOOH dwell times are 10-30× longer in 2026 than roadside billboard exposures.
- Contextual Trigger Performance (2026): According to Marketing LTB, weather-triggered DOOH increases engagement by 50% in 2026, and geo-fenced retargeting boosts conversions by 20-30% in 2026.
- Guaranteed Impressions Value (2026): According to InBeat, DOOH ads avoid ad blockers and guarantee impressions in 2026, making them valuable for retail media networks and advertisers.
Digital Signage Statistics for Smart Retail and Emerging Technologies (2026)
In 2026, smart retail and emerging signage technology signals point to rapid scaling and heavier reliance on analytics-ready networks, with the smart retail market sized at US$52.69 billion in 2026 and forecast to reach US$686.21 billion by 2035 from the 2026 baseline, while display innovation in 2026 focuses on high-brightness and fine-pitch formats such as 3,500-nit QSR screens and 8K LED facades.
Below are the 2026 smart retail and emerging technology statistics covering market size, regional shares, hardware mix, visual marketing adoption, performance optimization, and sensor-enabled analytics.
- Smart Retail Market Size (2026): According to Acumen Research, the global smart retail market is US$52.69 billion in 2026 and is forecast to reach US$686.21 billion by 2035, reflecting a 29.5% CAGR from the 2026 baseline.
- Smart Retail Regional Shares (2026): According to Acumen Research, North America holds 35% share of the smart retail market in 2026, while Asia-Pacific holds 22% share in 2026.
- Smart Retail Component and Use-Case Shares (2026): According to Acumen Research, hardware represents 65% of the smart retail market in 2026, and the visual marketing application holds 29% share in 2026.
- Digital Signage Growth Outlook Used for 2026 Benchmarking (2026 Context): According to Acumen Research, the global digital signage market is forecast to reach US$57.8 billion by 2032 at an 8.7% CAGR, with historical shares used for 2026 benchmarking showing North America held over 36% share in 2022, while hardware captured 57% and in-store installations accounted for 71% share in that reference mix.
- High-Brightness and Fine-Pitch Drivers (2026): According to Acumen Research, adoption in 2026 is driven by fine-pitch indoor LEDs and bright outdoor displays, including DOOH use cases such as 8K LED facades and 3,500-nit QSR screens in 2026.
- GPU Throughput and Bandwidth Reduction (2026): According to Astute Analytica, Samsung’s VXT CMS renders HTML5 playlists at 60 frames per second across 200 nodes in 2026, reducing bandwidth costs by 780 GB per month for a regional retail network in 2026.
- Sensor-Enabled Analytics (2026): According to Astute Analytica, time-of-flight cameras are embedded in displays in 2026 to enable anonymous viewer analytics.
- Large-Scale Retail Screen Footprint (2026 Context): According to Astute Analytica, Walmart operates 170,000 in-aisle screens across 4,300 stores as of fiscal 2024, used as the scaling reference for 2026 retail network expansion context.
Digital Signage Statistics for Education and Corporate Sector Trends (2026)
In 2026, education and corporate sector trends show digital signage functioning as both a core campus communications layer and a retail-style engagement driver, with institutions reporting near-universal use for campus news (100% in 2026) and strong customer behavior signals such as 78% checking loyalty information and 91% being more likely to revisit stores with interactive features in 2026.
Below are the 2026 education and corporate sector trend statistics covering campus use penetration, trust drivers, self-service behavior, digital expectations, and engagement outcomes.
- Campus Use Case Penetration (2026): According to Market.us, 100% of institutions use digital signage for institutional news in 2026, 86% use it for menu boards in 2026, 57% use it for scheduling and emergency notifications in 2026, and 43% use it for wayfinding in 2026.
- Loyalty Information and Screen Trust (2026): According to Gitnux, 78% of customers check digital displays for loyalty-program information in 2026, and 41% are more likely to trust a message on a high-resolution screen in 2026.
- Touch Interaction and Inventory Checks (2026): According to Gitnux, 59% of consumers are open to using a touchscreen to customize a product in 2026, and 33% use digital displays to check inventory availability in 2026.
- Self-Service Preference and Credibility (2026): According to Gitnux, 51% of customers prefer digital self-service ordering to avoid perceived judgment in 2026, and 69% view digital signage as a credible information source in 2026.
- Intrusiveness and Digital Expectations (2026): According to Gitnux, 71% feel digital signage advertising is less intrusive than online pop-ups in 2026, and 90% increasingly expect digital interactions in physical spaces in 2026.
- Social Proof Before Purchase (2026): According to Gitnux, 85% of shoppers like to see social proof or reviews displayed on digital screens before buying in 2026.
- Healthcare and Banking Cross-Vertical Recall (2026): According to Gitnux, 75% of hospital patients recall digital messaging in 2026, and 70% of banks use digital signage for entertainment to reduce waiting anxiety in 2026.
- Primary Benefit and Revisit Intent (2026): According to Gitnux, 64% of digital signage users cite increased customer engagement as the main benefit in 2026, and 91% of customers are more likely to revisit a store with interactive features in 2026.
Digital Signage Statistics for Media Player and Technology Trends (2026)
n 2026, media player and display technology trends show a shift toward higher-performance players, brighter and finer-pitch LED surfaces, and service-led integrator economics, with advanced-level media players generating 46.8% of revenue in 2026, retail driving 36.9% of media player sales in 2026, and hardware deployments increasingly defined by specs like 0.9 mm fine-pitch LED, 8,000-nit outdoor LED facades, and 10-bit HDR processing in 2026.
Below are the 2026 media player and technology trend statistics covering revenue mix, regional share, display innovation, and service-to-hardware value ratios.
- Revenue Mix and Enterprise Growth (2026): According to Mordor, advanced-level media player units generate 46.8% of revenue in 2026, and enterprise-level solutions are growing at a 10.51% CAGR from the 2026 outlook.
- Retail Application and North America Share (2026): According to Mordor, retail applications account for 36.9% of media player sales in 2026, and North America commands 33.2% of revenue in 2026.
- Fine-Pitch LED and Transparent OLED Adoption (2026): According to Astute Analytica, 0.9 mm pixel-pitch LED walls are being adopted for lifelike product rendering in 2026, and 55-inch transparent OLED sheets with 38% light transmission are being adopted in 2026.
- Outdoor HDR and Moiré-Free Retail Walls (2026): According to Astute Analytica, 8,000-nit outdoor LED facades run using 10-bit HDR processing in 2026, and indoor retail LED walls deliver life-size rendering without moiré in 2026.
- Service Revenue vs Hardware Sales (2026): According to Astute Analytica, integrators such as Stratacache, AVI-SPL, and Sharp/NEC derive service revenues that are 1.4× greater than initial hardware sales in 2026.
Digital Signage Research and Analytics Outlook (2026)
In 2026, research and analytics indicators show digital signage shifting toward cloud-managed, data-driven networks, with 60% of deployments expected to be cloud-based by 2026, 70% of users wanting analytics to optimize content in 2026, and software economics defined by US$8-20 per screen per month in 2026 alongside software revenue rising to US$12.96 billion in 2026.

Below are the 2026 research and analytics statistics covering cloud adoption, U.S. and global growth paths, consumer behavior signals, cost of ownership ranges, and privacy concerns.
- Global Market Growth Path (2026 Context): According to Verified Market Research, the global digital signage market grows from US$8.22 billion in 2024 toward US$16.03 billion by 2031, reflecting a 9.60% CAGR across the timeline used for 2026 forecasting.
- Cloud Deployment Shift (2026): According to Verified Market Research, 60% of digital signage deployments are expected to be cloud-based by 2026, up from 38% in 2020.
- U.S. Market Growth Path (2026 Context): According to Verified Market Research, the U.S. digital signage market increases from US$8.43 billion in 2024 to US$12.16 billion by 2032, reflecting a 7.88% CAGR across the timeline used for 2026 planning.
- Store Entry Influence (2026): According to Verified Market Research, 61% of consumers are more likely to enter a store with dynamic digital signage in 2026.
- Analytics Interest (2026): According to Verified Market Research, 70% of users are interested in data analytics to optimize digital signage content in 2026.
- Total Cost of Ownership Range (2026): According to Verified Market Research, total cost of ownership for digital signage ranges between US$5,000 and US$50,000 in 2026, depending on installation complexity.
- Privacy Concern Rate (2026): According to Verified Market Research, 42% of consumers are concerned about data privacy when digital signage collects customer information in 2026.
- Retail Investment Momentum (2026 Context): According to Verified Market Research, 75% of retailers planned to invest in digital signage by 2022, which is cited as continued momentum informing 2026 market direction understanding.
- Software Subscription Pricing (2026): According to Verified Market Research, typical pricing for digital signage software ranges from US$8-20 per screen per month in 2026.
- Software Market Value Growth (2026): According to Verified Market Research, digital signage software generates US$11.43 billion in 2024 and reaches US$12.96 billion in 2026, expanding at a 13.4% CAGR across the growth window used for 2026 forecasting.
Digital Signage Adoption and ROI (2026)
In 2026, adoption and ROI signals show digital signage driving attention, action, and operational gains at scale, including 63% reporting screens catch attention in 2026, a 19% higher likelihood of unplanned purchases in 2026, perceived wait-time reductions up to 35% in 2026, and productivity gains of 20-25% in 2026, while market sizing benchmarks place the industry at US$27.13-US$31.8 billion in 2026 and reinforce in-store dominance with 73%+ share context feeding into 2026.
Below are the 2026 adoption and ROI statistics covering consumer behavior, retail impact, workplace outcomes, market growth paths, and DOOH expansion signals.
- Attention and Public Exposure (2026): According to Gitnux, 63% of people report digital signage catches their attention in 2026, and 70% of Americans say they have seen a digital video display in a public venue in the last month in 2026.
- Impulse Purchase Lift (2026): According to Gitnux, customers are 19% more likely to make an unplanned purchase after seeing digital signage in 2026.
- Wait-Time and Productivity Gains (2026): According to Gitnux, digital signage reduces perceived checkout wait times by up to 35% in 2026, and increases employee productivity by 20-25% in 2026.
- Local Signage Recall Context (2026): According to Gitnux, 85% of customers live or work within a five-mile radius of a business in 2026, reinforcing local signage relevance in 2026.
- Signage Quality and Sales Impact (2026): According to Gitnux, 34% of North American shoppers associate signage quality with store cleanliness in 2026, and nearly 60% of businesses report positive sales impacts after improving signage visibility in 2026.
- Point-of-Sale Triggers (2026): According to Gitnux, 1 in 5 unplanned purchases are triggered by visual point-of-sale signage in 2026.
- Interactive Standout Effect (2026): According to Gitnux, 71% of consumers feel interactive digital signage makes a brand stand out in 2026, and 63% say digital signage catches their attention more than TV, internet, and billboard advertising in 2026.
- Outside-Store Influence (2026): According to Gitnux, digital signage reduces wait times by up to 35% in 2026, and 40% of shoppers say digital displays outside a store can change what they buy in 2026.
- Mood and Engagement Multiplier (2026): According to Gitnux, 81% of shoppers say entertainment content on digital signage improves mood in 2026, and interactive digital signage generates 5× more engagement than static signage in 2026.
- Experience and Core Benefit (2026): According to Gitnux, 46% of customers agree digital signage creates a better shopping experience in 2026, and 64% of users cite increased customer engagement as the main benefit in 2026.
- Revisit Intent (2026): According to Gitnux, 91% of customers are more likely to revisit a store that features interactive digital signage in 2026.
- Cross-Industry Outcomes (2026): According to Gitnux, 75% of caregivers view digital signage as a way to enhance hospital communications in 2026, and digital signage in manufacturing plants can reduce workplace injury rates by 20% in 2026.
- Investment and Cost Reduction (2026): According to Gitnux, 56% of internal communication teams are considering increasing investment in digital signage in 2026, and replacing paper notices with digital signage reduces printing costs by 30% in 2026.
- Email Overload Signal (2026): According to Gitnux, 60% of companies without a digital signage strategy struggle with information overload via email in 2026.
- Guaranteed Impressions (2026): According to InBeat, DOOH provides guaranteed impressions in 2026 because ads cannot be skipped.
- Retail Network Scale (2026 Context): According to Astute Analytica, Walmart operates 170,000 in-aisle screens across 4,300 stores as the scale reference used for 2026 retail expansion context.
- SoC Replacement Trend (2026 Context): According to Astute Analytica, system-on-chip screens eliminate standalone media players in 3.2 million installations in the baseline used for 2026 architecture planning.
- Market Size by Year (2026): According to Precedence Research, the digital signage market is US$27.13 billion in 2026, rises to US$31.42 billion in 2026, and reaches US$57.72 billion in 2035.
- In-Store Dominance Context (2026): According to Precedence Research, the in-store location segment holds more than 73% share in the baseline used to frame 2026 in-store dominance.
- Market Revenue Path (2026): According to Market.us, digital signage market revenues are projected at US$31.8 billion in 2026, following US$28.9 billion in 2024 and leading into US$34.7 billion in 2026.
- Cross-Industry Adoption Snapshot (2026): According to Market.us, digital signage adoption in 2026 includes education (73% of institutions consider it vital), manufacturing (injuries reduced by 20%), banking (87% say it increases trust), retail (90% find videos helpful), media/advertising (91% recognize demand for personalized ads), and healthcare (70% of hospitals have communication systems).
- Growth Drivers (2026): According to Research and Markets, digital signage growth in 2026 is driven by increased retail and advertising expenditure and improved customer experiences.
- Fast-Growing Product Segments (2026): According to Grand View Research, transparent LED screens rank among the fastest-growing product segments in 2026, and immersive video walls drive demand across entertainment and retail in 2026.
- Healthcare and SMB Market Signals (2026): According to Global Market Insights, healthcare holds 20.2% of the market in 2026, and the small-business segment is worth US$9.4 billion as the baseline used for 2026 SMB context.
- Smart City Enablement (2026): According to IMARC Group, more than 500 cities will implement digital twin technology by 2026, potentially saving US$280 billion by 2030, with digital signage positioned as part of smart-city initiatives in 2026.
- North America Share (2026): According to IMARC Group, North America holds 37.2% of the global digital signage market used for 2026 regional dominance context.
- Industry Growth Areas (2026): According to Knowledge Sourcing Intelligence, growth in 2026 is propelled by rising adoption of digital signage solutions in retail, hospitality, and entertainment.
- Market Growth Path (2026): According to 360iResearch, the market grows from US$26.21 billion in 2024 to US$28.27 billion in 2026, with a projection toward US$48.61 billion by 2032 from the 2026 baseline.
- DOOH Revenue Growth Rate (2026): According to Talon Outdoor, DOOH revenue grows 8.44% annually from the 2026 outlook toward US$22 billion, highlighting the increasing role of digital screens in outdoor advertising in 2026.
In 2026, digital signage remains a growth market with global valuations reported between US$23.05 billion and US$31.8 billion in 2026, and 2026-based projections extending to US$34 billion by 2029, US$38.992-US$45,941.2 million by 2030, and US$46.80-US$57.72 billion by 2033-2035. Regional positioning in 2026 stays concentrated, with North America holding roughly 33.4-37.2% share across the benchmarks used in 2026 planning, while Asia-Pacific is the fastest-growing region from a 2026 outlook at 8.5% CAGR.
All these 2026 statistics point in the same direction: digital signage is scaling fast, and the winners will be the operators who can deploy, update, and measure content without adding complexity. That makes 2026 less about “buying screens” and more about choosing a content management platform that stays reliable as networks grow, campaigns get more dynamic, and stakeholders demand proof of performance.
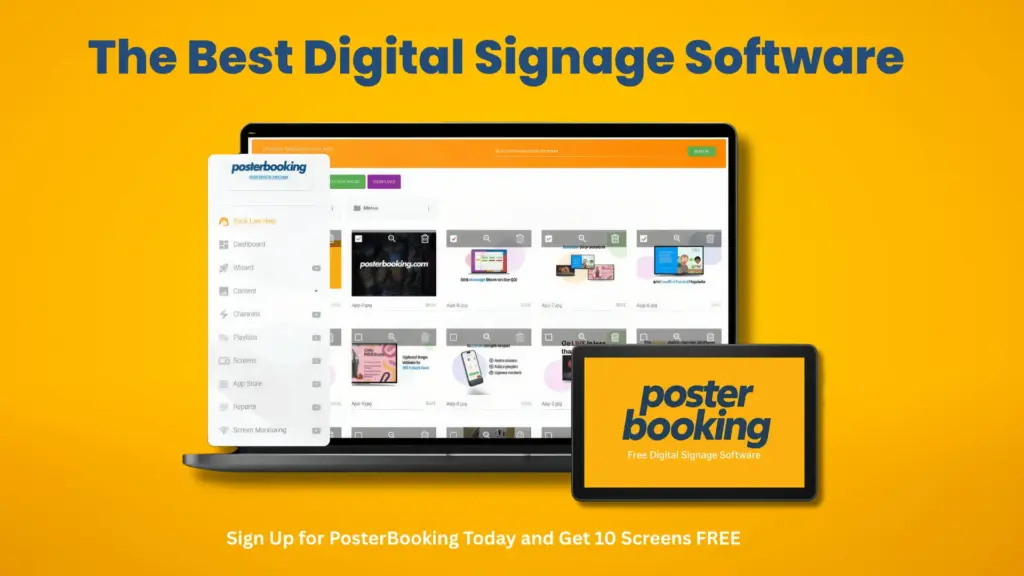
For that reason, PosterBooking stands out as one of the best digital signage software options in 2026, especially for teams that want to launch quickly and scale responsibly. It’s also a practical starting point because PosterBooking is free for up to 10 screens, which makes it easy to test real-world playback, scheduling, and network control before committing budget to a larger rollout.
Join the Best Digital Signage Software in 2026
Frequently Asked Questions
What is the total market size for digital signage in 2026?
The global market is estimated to be worth between US$23.05 billion and US$29.19 billion in 2026. This range indicates a period of active growth for the industry rather than a mature or declining phase. Growth rates for this period are reported to be as high as 9.1 percent.
How much does digital signage increase retail sales and foot traffic?
Retail digital signage is projected to drive significant results in 2026, including a 24 percent increase in foot traffic and sales growth of up to 33 percent. Additionally, 76 percent of consumers report entering a store specifically because of appealing digital signage. Data shows that 67 percent of shoppers make purchases based on content seen on these screens.
How long does it take to set up a digital signage screen?
Digital signage displays can be set up in about 2 minutes using PosterBooking. The software works on various hardware including Fire TV Stick, Android TV, Windows, and Raspberry Pi. Content is available for offline playback via caching to ensure reliability.
What percentage of the OOH market will be digital in 2026?
DOOH is expected to account for 30 to 35 percent of all out of home advertising spend in 2026. The digital segment is growing at 10 to 12 percent annually, which outpaces traditional OOH growth. Global digital OOH revenue is predicted to reach US$22 billion by this time.
How much does it cost to use PosterBooking for digital signage?
PosterBooking is free for up to 10 screens, though these screens will show a watermark after a 3 month trial. For deployments without watermarks, the Home Basic plan costs $52 per month for 10 screens. Larger options include Business Pro for $520 per month with unlimited screens or Enterprise Plus for $830 per month.
Sources
- https://www.researchandmarkets.com/reports/5767321/digital-signage-market-report
- https://www.skyquestt.com/report/digital-signage-market
- https://www.mordorintelligence.com/industry-reports/digital-signage-market-industry
- https://www.grandviewresearch.com/horizon/outlook/digital-signage-market-size/global
- https://www.technavio.com/report/digital-signage-market-industry-analysis
- https://www.precedenceresearch.com/digital-signage-market
- https://www.knowledge-sourcing.com/report/global-digital-signage-market
- https://www.digitalsignagetoday.com/news/nielsen-study-dooh-increases-revenue-at-the-point-of-sale-2/
- https://www.digitalsignagetoday.com/blogs/beating-the-elements-with-outdoor-digital-signage-infographic/
- https://www.imarcgroup.com/digital-signage-market
- https://www.astuteanalytica.com/industry-report/digital-signage-market
- https://www.marketsandmarkets.com/Market-Reports/north-american-digital-signage-market-35061554.html
- https://www.gminsights.com/industry-analysis/digital-signage-market-report
- https://www.gminsights.com/industry-analysis/digital-signage-market-report
- https://marketingltb.com/blog/statistics/out-of-home-ooh-advertising-statistics
- https://talonooh.com/2026-ooh-trends
- https://inbeat.agency/blog/dooh-advertising
- https://gitnux.org/sign-industry-statistics/
- https://www.globenewswire.com/news-release/2023/10/18/2762626/0/en/Digital-Signage-Market-Set-to-Soar-Forecasting-a-USD-57-8-Billion-Milestone-by-2032-at-8-7-CAGR.html
- https://research.com/software/digital-signage-software-for-small-teams